Quality Reserves in Distribution Networks – QuVert Research Project with Camille Bauer Measuring Instruments
For the cost-efficient design and stable operation of distribution grids, it is essential to understand the influence of different grid variants and load conditions on the voltage quality. To this end, the quality reserves were analyzed and a monitoring concept was formulated.
In the research project QuVert (Utilization of Quality Reserves in Distribution Networks), which is supported by the Swiss Federal Office of Energy SFOE, a team of the Laboratory for Electricity Networks of BFH together with eight partners is researching how much reserve the distribution networks have with regard to voltage quality and how the increasing network utilization affects the phenomena described by the standard [1]. Voltage quality is not recorded across the board in low-voltage grids because of the high expense involved. Its characteristics and the influences on the power grid by new plants can therefore not be scientifically assessed with the data available so far.
To investigate the quality reserves, the project will record the voltage quality (PQ) in six selected low-voltage grids for several months to a year. This will include an analysis of the impact on compliance with EN 50160 [2] when plants are operated beyond the limits of the current rules [3] that distribution system operators (DSOs) apply when assessing connection requests. The aim of the project is to show the SFOE, ElCom and the DSOs the economic potential of the “monitoring”, “smart grid” and “network expansion/reinforcement” measures, respectively, on the basis of measurements in real distribution networks and a comprehensive data analysis.
Grid selection
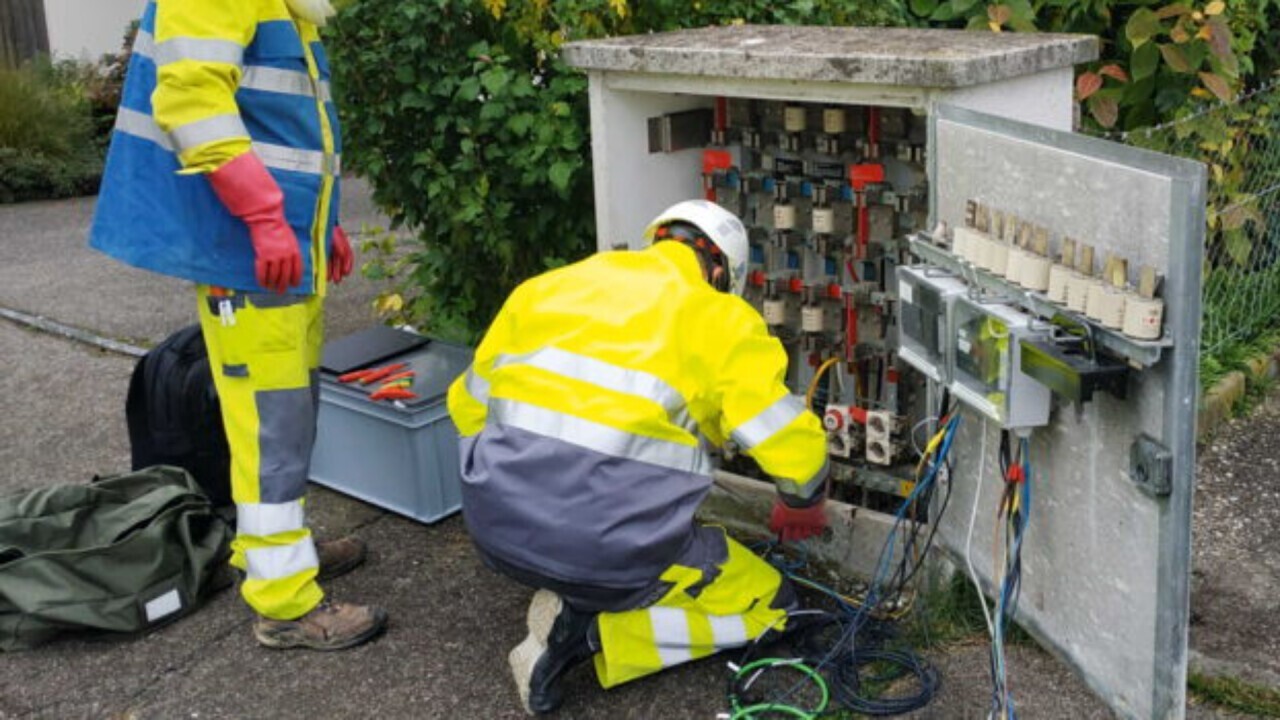
Since the grid topology and the device or plant structure is different in each distribution grid, it is important that different grids can be investigated. In the selected grids of the seven grid operators involved (Energie Service Biel/Bienne, Energie Thun, IB-Murten, AEW, Primeo Energie, Repower and SIG), PV systems, heat pumps and charging infrastructure are connected in addition to the loads. The grids were equipped area-wide with the Linax PQ5000 PQ meters from Camille Bauer Metrawatt, a company involved in the project.
Measurement campaigns
Voltage quality and utilization are analyzed in the networks of the project partners. The influence of switching in the network and of measures is investigated. The duration of the measurements depends on the phenomenon to be observed. In grids with a high penetration of PV systems, for example, the highest voltage values are measured in summer and the lowest in winter over a period of about one year. This should show which measures are technically and economically sensible for reliable grid operation. Based on the measurement results, the relevant parameters will be determined for the selective and continuous monitoring of the distribution grids and a generic monitoring concept will be developed.
Quality reserves
To assess the quality reserves, the distance of each PQ parameter from the respective limit value according to EN 50160 is considered.
The quality reserves are specified in pu (per unit) and can assume values between 0 (0% reserve) and 1 (100% reserve). For example, 1.00 pu means that a voltage harmonic has a level of 0 V. If the limit value was reached or exceeded during the measurement, this results in a reserve of 0.00 pu. For the evaluation according to EN 50160, a full weekly interval must be considered in each case. The measurement data were therefore divided into calendar weeks.

Figure 1: Measured quality reserves with regard to EN 50160 at the three measuring points C1P1-60 (PV system), C1V1 and C1V2 (distribution cabins) of a low-voltage grid with low quality reserves and limit violations.
The quality reserves are greater than 0.30 pu at most of the measurement points of the five networks measured so far, and often also greater than 0.50 pu. In many cases, the lowest reserve was measured at the 7th and 9th voltage harmonics (Uh7 and Uh9) and at the voltage rms value in relation to the upper voltage limit (Umax). Traditionally, the transformer stages in many grids are still set for load operation, so the voltage in the lightly loaded case is significantly higher than 230 V (phase-neutral). The increasing PV feed-in leads to certain measuring points showing critically high supply voltages. This was particularly evident in the following case:
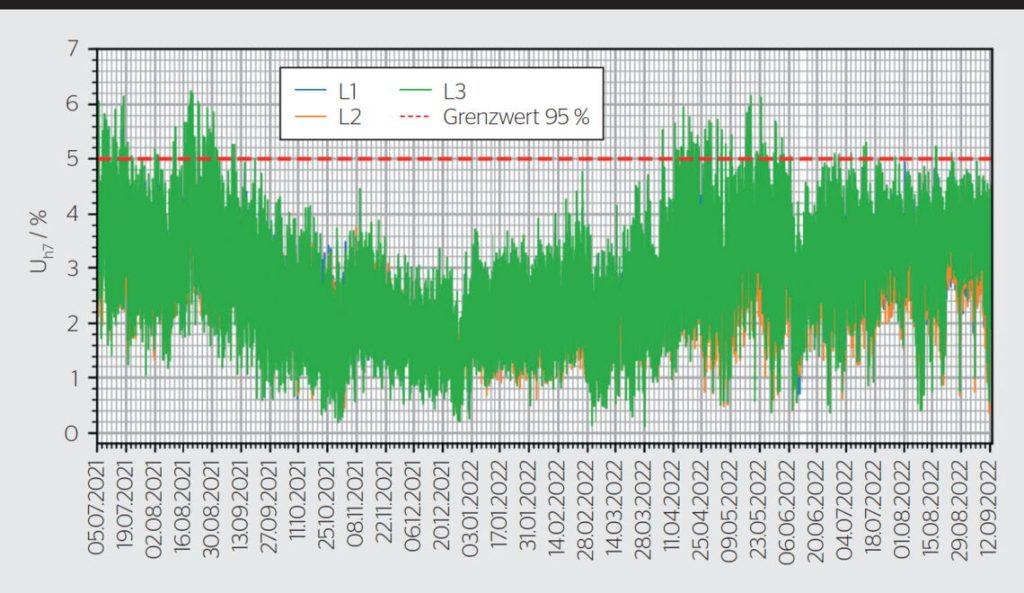
Limit violations occurred in only one of all measured grids. Due to the low short-circuit power and the accumulation of PV plants and loads, only very low quality reserves are left for eight PQ parameters (Fig. 1). The PV systems increase the voltage level, and the reserve to the upper voltage limit (Umax) is almost used up in summer. The phase conductors are unevenly loaded, so the unbalance of the supply voltage tends to have low reserves in winter when many loads are operated. The harmonic voltages with low ordinal numbers are particularly problematic. Limit violations occur with the 3rd voltage harmonic in winter, and with the 7th voltage harmonic in summer (Fig. 2). The reserves of the 5th and 9th voltage harmonics are also very low.

Figure 2 Measured curve of the 7th voltage harmonic (Uh7) with critical levels in the summer half-year (measuring point C1P1-60), with 95% limit value according to EN 50160 marked (red line).
The measurement data show that the voltage level has reached a critical value with increasing PV production and decreasing load in summer. To prevent the limit from being violated, the PV system was already limited to 60% of the nominal power at the most critical measuring point. The reserve for undervoltage (Umin) was never below 54% in the half-year under consideration. The investigated measuring points therefore allow an adjustment of the transformer stage. In order to exclude a possible violation of the lower voltage limit, however, the voltage levels at all network nodes must be checked during heavy load periods.
In certain cases, changing the transformer stage could be sufficient as a first measure to reduce the voltage level in the entire grid. However, additional PV additions will lead to a further increase in voltage levels. In this context, simulations have shown that both P(U) control and Q(U) control are simple and reasonable measures for maintaining the voltage band. The costs and benefits of such a solution should therefore be compared to grid reinforcement. Critically low voltage values due to an accumulation of electric vehicles could not be detected because of the low penetration of electromobility in the investigated grids. At the time of publication of this article, a measurement campaign is being conducted in another distribution network with significant total charging infrastructure, the results of which will be published later.
If grid operators take the technical connection rules into account, the voltage quality is usually very high. In individual cases, the quality reserves are tight, or limit values of EN 50160 are violated, especially if a high system power in relation to the short-circuit power has been permitted. However, limit violations do not automatically mean that connected devices are disturbed, since limit values are usually lower than the interference immunity required by the devices. It should also be noted, however, that compliance with the limit value does not guarantee that no interference will occur, because if the 10-minute average values are considered exclusively, individual short-term outliers with interference potential may remain undetected.
Grid impedance
If high levels of voltage harmonics are detected for certain ordinal numbers, it makes sense to measure the network impedance at the affected frequencies. If it is increased at a certain frequency, even relatively small current harmonics will cause relevant voltage harmonics. Measurements should be made at connection points with conspicuous voltage harmonics on the one hand, and at network nodes where further plants are to be connected in the future on the other. In this way, it will be possible to better estimate network perturbations that would be caused by the new plants.
In the project, the network impedance measurements are carried out with the ONIS 1000 Premium online network impedance spectrometer from morEnergy. The instrument measures frequency-dependent network impedance from DC to 150 kHz three-phase. The current analysis is limited to the consideration of the frequency range according to EN 50160: The range up to 1.25 kHz (voltage harmonics) or up to 2 kHz (total harmonic content of the voltage THDu) is considered.

Figure 3: Curve of the measured mains impedance with the maximum at around 350 Hz (7th harmonic).
In the time course of the 7th voltage harmonic of a selected measuring point, limit violations are regularly visible (Fig. 2). The corresponding curve of the mains impedance shows a maximum at almost exactly 350 Hz, i.e. at the frequency of the 7th voltage harmonic (Fig. 3). A current harmonic at this frequency thus causes stronger network feedback than one with the same amplitude at other frequencies.
After this maximum (from 550 Hz to 2 kHz), the line impedance is again significantly lower. Since the line impedance should actually increase with increasing frequency due to the longitudinal impedance of the (inductive) line, this effect is probably due to the input capacitances of the connected devices. These lower impedances result in some damping of the voltage harmonics at these frequencies. This is also shown by the measured quality reserves of the voltage harmonics from the 11th order in Fig. 1. From the 11th to the 25th voltage harmonic, all harmonics have quality reserves of at least 0.71 pu; i.e. 71% of the allowed range is not utilized.
Generic monitoring concept
An important goal of the project is to contrast the measures “smart grid” and “grid expansion/reinforcement” with a possible alternative “monitoring of quality reserves”. For this purpose, a benchmark for a generic monitoring concept is defined, which specifies which data and data quality are required when monitoring distribution grids. The benchmark serves as a recommendation for the development of PQ measuring equipment and for the acquisition of PQ data in the low-voltage network.
In addition to the requirements for the measurement equipment, the right choice of measurement points in the power grid is crucial. For example, a measurement in a transformer station can give a general impression of the network situation, but the quality at critical network nodes cannot be reliably derived from this. Therefore, it is advisable to identify the network nodes with potentially poor voltage quality at which monitoring of the PQ parameters is to be performed. In Bulletin SEV/VSE 5/2022, an approach was presented to categorize such network nodes. In addition, measurements could also make sense at nodes where expansion measures are expensive and, in comparison, permanent monitoring by means of measurement technology creates the certainty that the voltage quality parameters do not violate any limit values.
Outlook
So far, the project has been concerned with measuring the load and voltage quality when applying the current connection rules and looking at the effects of the addition of plants without measures on the grid.
In a further step, the measures “monitoring”, “smart grid” and “grid expansion/reinforcement” are compared. Finally, general recommendations for the planning and operation of distribution grids will be given in addition to the currently used rules for the assessment of grid feedback (e.g., Technical Rules for the Assessment of Grid Feedback D-A-CH-CZ [3]). In addition, ideas for the further development of EN 50160 are to be developed. The final project report will be published in spring 2024.
References
- www.bfh.ch | Projekte
- EN 50160, Merkmale der Spannung in öffentlichen Elektrizitätsversorgungsnetzen, 2020.
- Technische Regeln zur Beurteilung von Netzrückwirkungen, VSE, OE, VDE FNN, CSRES, 2021.
Link: www.bfh.ch | Labor Elektrizitätsnetze
Thanks to
Special thanks go to the Swiss Federal Office of Energy SFOE and the participating institutions for their support. In addition to the Bern University of Applied Sciences, the University of Applied Sciences of Western Switzerland (HES-SO Valais- Valais), Camille Bauer Metrawatt AG, AEW Energie AG, Energie Service Biel/Bienne, Energie Thun AG, IB-Murten, Repower AG, Primeo Energie and Services Industriels de Genève are also involved in the QuVert project.
Download: 2023_4_Schori_Qualitaetsreserven_in_Verteilnetzen.pdf
Source: www.bulletin.ch | Qualitaetsreserven Authors
Stefan Schori is a tenure-track lecturer and group leader in the Electricity Networks Laboratory at Bern University of Applied Sciences.
As Professor of Energy Systems, Michael Höckel leads both the Electricity Networks Laboratory and the Hydrogen Systems Laboratory of the Bern University of Applied Sciencese.
Ron Buntschu works as a research associate in the Laboratory for Electricity Networks at the Bern University of Applied Sciences.


